
Fourth Quarter 2023 Outlook
Key Dates and Levels Price is Likely
to Visit Before Yearend
As we step into the final quarter of 2023, traders and investors are keenly observing the evolving dynamics in the financial markets. The fourth quarter holds the promise of new opportunities and challenges, and understanding the key levels and targets can be invaluable for navigating this period effectively.
S&P 500: Pressing Down to Attack Lows

The S&P 500, a leading indicator of the broader U.S. stock market, has turned the corner on its upward trajectory to Bearish. As we enter the final quarter, key levels to watch include:
Midpoint of Sept 18th Bearish Gap: The S&P 500 was overzealous in it's push away from the January 2022 Bearish Gap and how we retrace back into this new gap from September is crucial for identifying the market's sentiment. Since price broke the swing low after the rejection at 4,399.00 and further confirmed our bearish sentiment. We do not want to see price close above 50% of this gap which is listed in red above at 4,437.75. Note: Price could run higher but we don't want to see any closes above here.
Support Levels: While the market climbs, support levels will be essential for gauging potential pullbacks. Traders should be vigilant about these levels to manage risk effectively. Notice when price drops down into the 50% level of the long term range, price starts to find support here. This support is short-term and likely only going to push price back up into the September 18th gap. Pay attention to this level because it will validate or invalidate our quarterly bias.
Economic Indicators: In a globally connected market, monitoring economic indicators and central bank decisions will play a vital role in guiding market sentiment. See Bonds and Dollar Below for more details.
Nasdaq: Tech and Growth Focus

The Nasdaq, dominated by technology and growth stocks, presents unique opportunities. Key levels and targets include:
Tech Sector Momentum: With the tech sector's continuous innovation, monitoring the Nasdaq's performance is crucial. Watch for key equal low levels of "support" at 14,596.50 be targted and resistance with the two bearish gaps reactions above price gauge potential movements. Price would have to knife through two layers of resistance to push higher and as the leader in indicies this year, it seems unlikely to get through both but we will see as price retraces into the gap above. Just like the S&P, we don't want to see price close above this 15,208.75 level shown above.
Earnings Reports: Tech companies' earnings report season can significantly impact the Nasdaq by injecting huge opportunities in volatility injections. Keeping track of these releases is essential for informed decision-making. With interest rate hikes losing steam, the earnings releases are primed to really push price around in Q4.
Global Events: In today's interconnected world, geopolitical events can influence tech stocks. Stay informed about global developments that may affect the Nasdaq especially when it comes to the war in Ukraine.
Treasury Bonds: The Nose Dive Continues
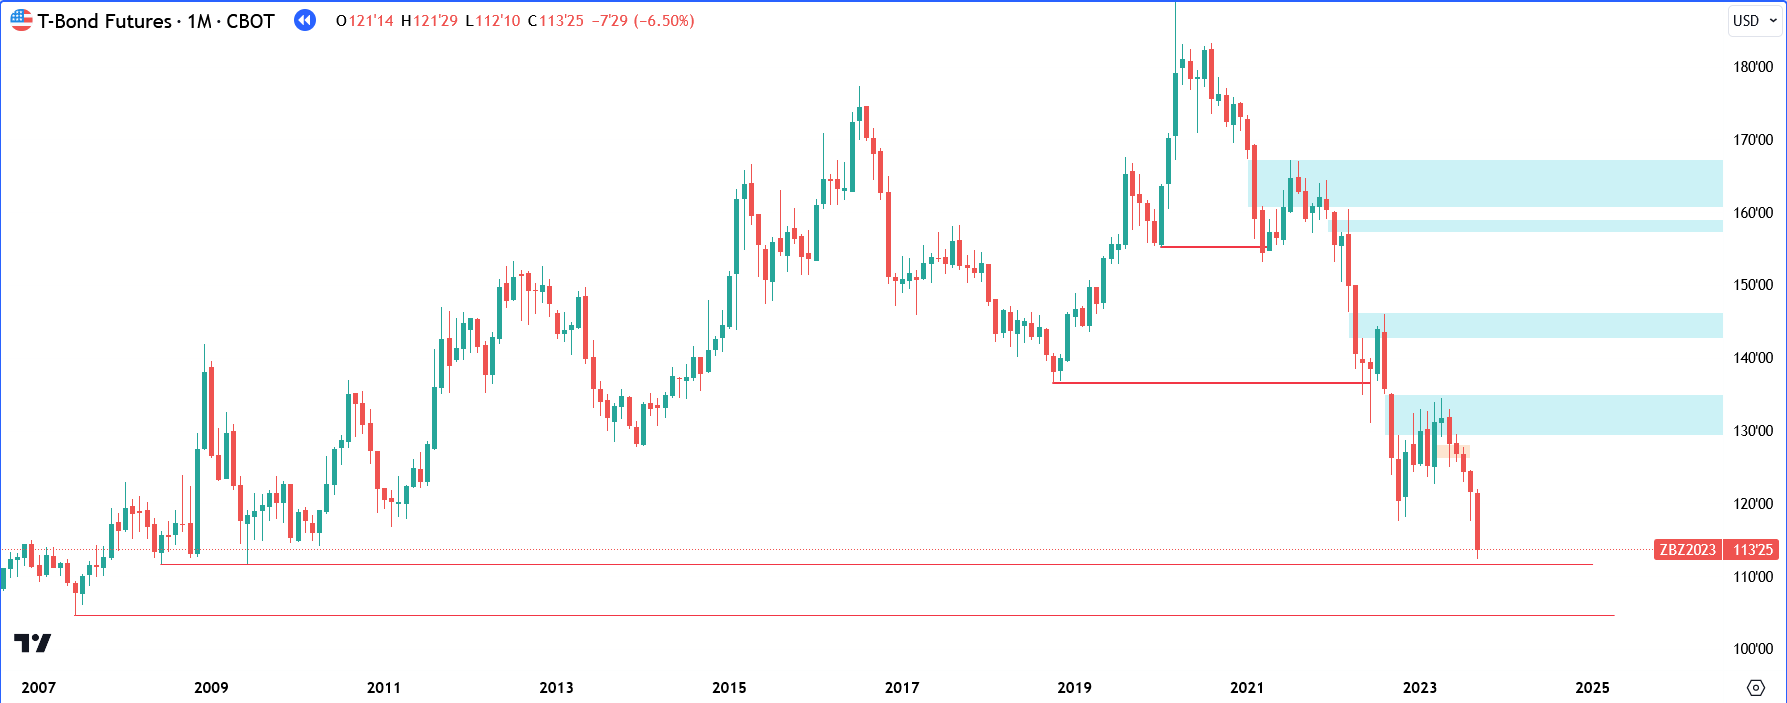
Treasury Bonds are usually safe investments but this bearish market is crushing TBonds. Note the blue bearish gaps which have held price down since February 2021. Important levels to consider are:
Equal Lows: As yields sink further to the downside, watching for key support levels will provide insights into investor sentiment and potential market directional moves. Case in point, note the equal lows from June 2008 & 2009 which have not been met yet. Price will likely reach these areas and we must watch to see if price finds support here for a retracement, or if price is still bearish overall.
Inflation Data: Inflation and interest rate decisions will impact Treasury Bonds since they are diametrically opposed to Interest Rates. Keeping an eye on inflation data and central bank announcements is essential. If support is found, look for a retracement back up to 117'19. An aggressive descent could lead us to take out the lows resting from June 2007 lows at 104'16 which seems unlikely before the close of the year.
Dollar Index: Currency Moves

The Dollar Index rules the world and reflects the U.S. dollar's strength against a basket of major currencies. Keep an eye on:
Early Consolidation Likely: The Dollar Index has reached the 50% level of it's current range listed at 106.623. This area is typically where we will see consolidations. The Dollar can be influenced by major currency pairs like EUR/USD, USD/JPY, and GBP/USD. Monitoring these pairs can offer clues about the dollar's performance. Price action is tougher to gauge at 50%. You want to see some sort of break of a range to gauge rather price wants to go higher or lower. Don't force anything and let price show you where it wants to go.
Beware of how price behaves around this 50% level. If price trades through it with a close above, look for a push higher into the yellow bearish gap (shown above). We wouldn't want to see price break through the mid-point shown with the red line at 108.405 if we expect the dollar to drop. If price does trade through the gap, see how price behaves. If price is bearish, the gap will serve as resistance and if bullish, the gap will serve as support.
Global Economic Conditions: Economic conditions worldwide can affect the Dollar Index. Stay informed about global economic data and events that may sway currency markets on top of high impact news drivers.
Key Takeaways: Informed Decision-Making

The fourth quarter of 2023 holds the potential for both opportunities and challenges. To navigate this period effectively, staying informed about key levels, economic indicators, and global events is paramount. Whether you're trading the S&P 500, Nasdaq, Treasury Bonds, or the Dollar Index, having a clear understanding of the factors that influence these markets is essential.
As we move forward, adaptability and informed decision-making will be your strongest allies in achieving financial success in the dynamic world of trading and investing. Be patient and allow price to show it's hand before taking action. Trading with evidence and clarity beats probabilities 100% of the time.
Disclaimer: The content in this market outlook is for informational purposes only and should not be construed as financial advice or trading recommendations. Please conduct thorough research and consult with financial professionals before making any trading and/or investment decisions.
Want to Stay Informed? Enter in your contact details below:
ABOUT
Red Clay helps traders discover a new way to see price which gives way for confidence, clarity and consistency free of guesswork or gambling.

Powered by ©Red Clay Trading Group, LLC
Disclaimer:
We Are Not Financial Advisors or a Broker/Dealer: Neither Red Clay Trading Group® nor any of its officers, employees, representatives, agents, or independent contractors are, in such capacities, licensed financial advisors, registered investment advisers, or registered broker-dealers. Red Clay Trading Group® does not provide investment or financial advice or make investment recommendations, nor is it in the business of transacting trades, nor does it direct client commodity accounts or give commodity trading advice tailored to any particular client’s situation. Nothing contained in this communication constitutes a solicitation, recommendation, promotion, endorsement, or offer by Red Clay Trading Group® of any particular security, transaction, or investment.
Securities Used as Examples: The security used in this example is used for illustrative purposes only. Red Clay Trading Group® is not recommending that you buy or sell this or any security. Past performance shown in examples may not be indicative of future performance.
Investing Risk: Trading securities can involve high risk and the loss of any funds invested. Investment information provided may not be appropriate for all investors and is provided without respect to individual investor financial sophistication, financial situation, investing time horizon, or risk tolerance.
Options Trading Risk: Options trading is generally more complex than stock trading and may not be suitable for some investors. Granting options and some other options strategies can result in the loss of more than the original amount invested. Before trading options, a person should review the document Characteristics and Risks of Standardized Options, available from your broker or any exchange on which options are traded.
No part of this website may be copied, recorded, or rebroadcast in any form without the prior written consent of Red Clay Trading Group®